Showing posts with label Tableau. Show all posts

Friday, December 18, 2020

Major League Soccer 2019 Statistics

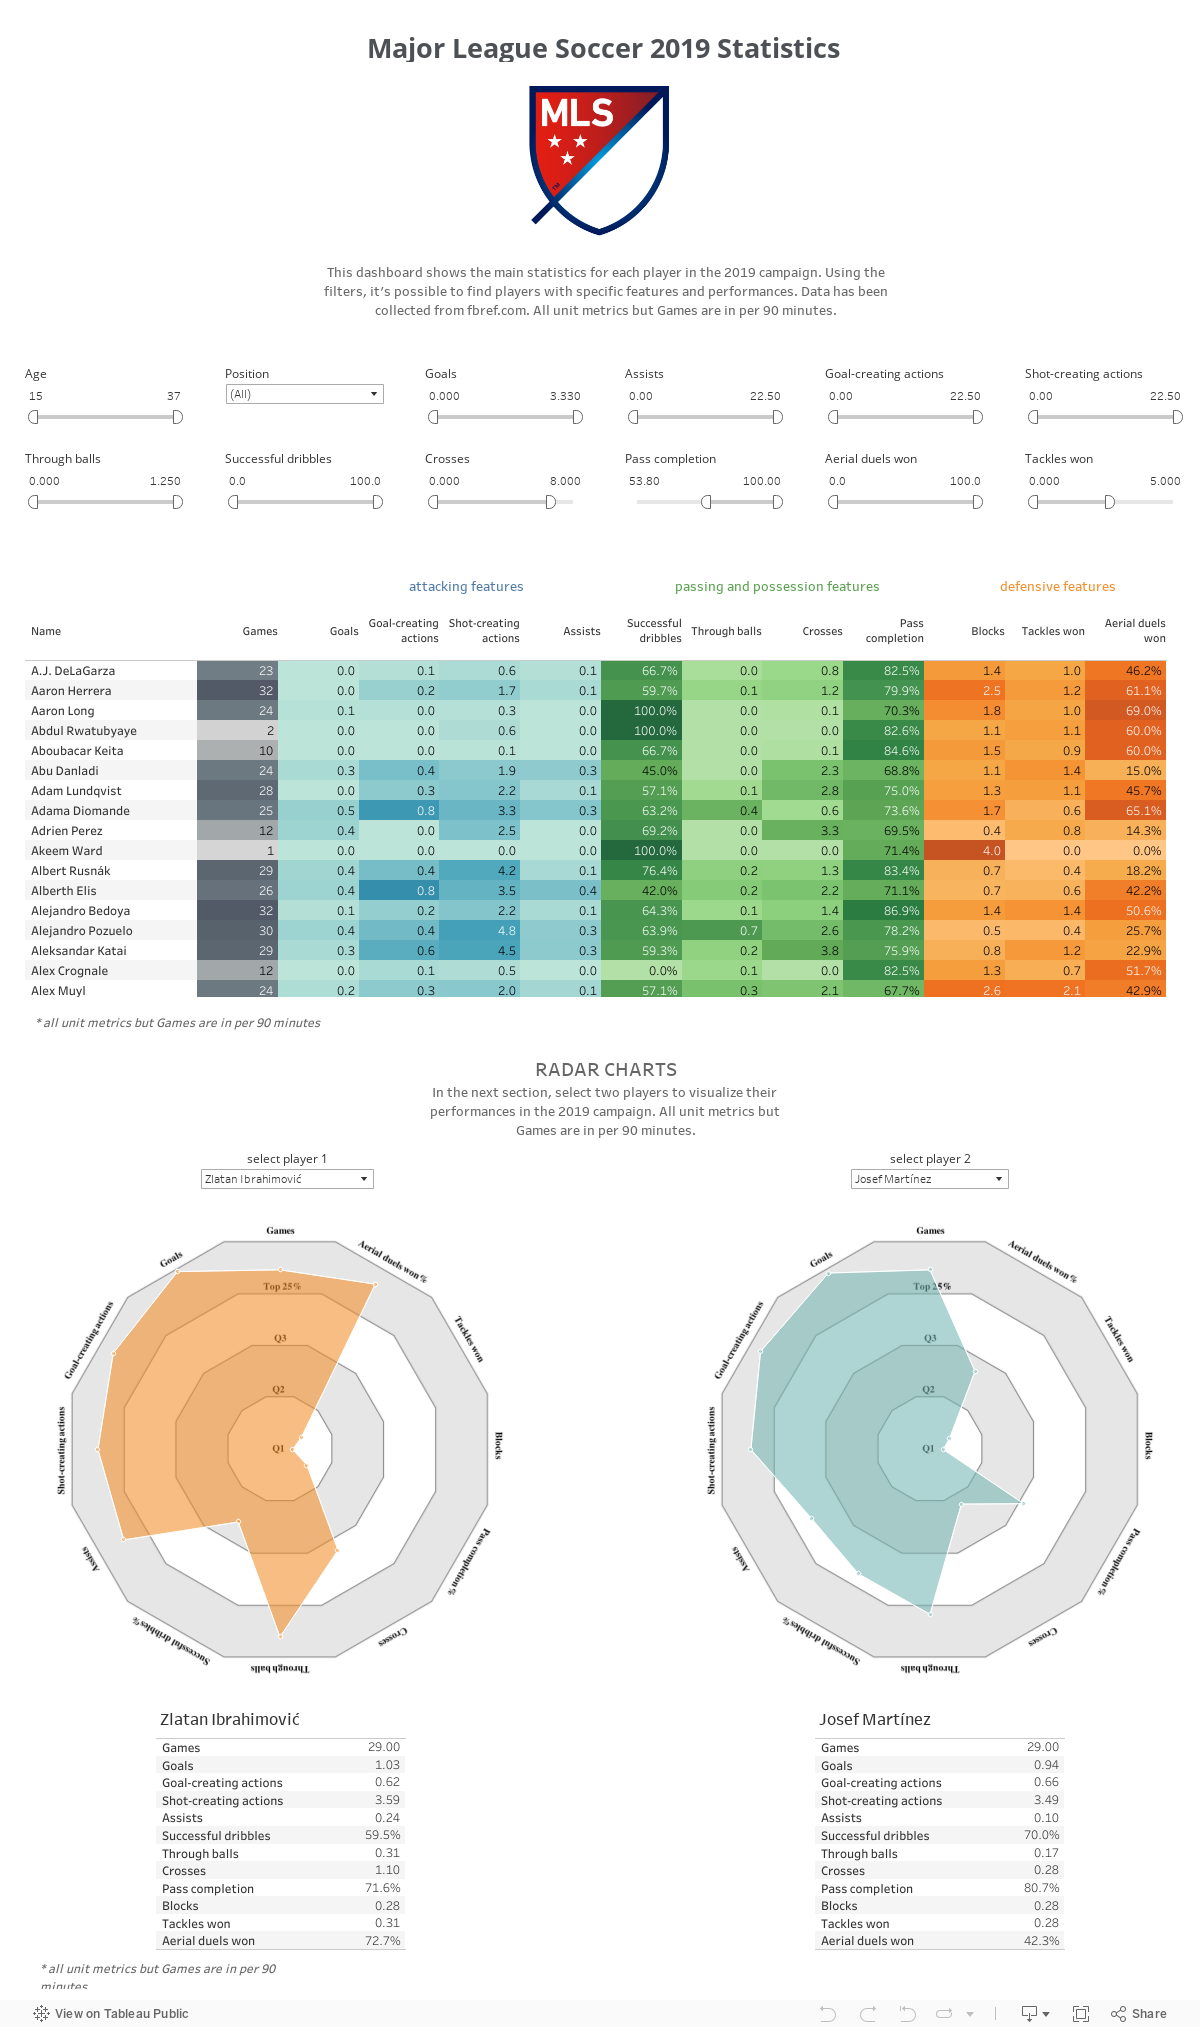
Data analytics in soccer is a growing and thrilling field. In this exercise, I used Python to scrape data about the 2019 MLS campaign from fbref.com. Then, I built a table with filters and radar charts to compare the performances of different players. A radar chart is a common tool in the professionals' daily work. For example, when it comes to scouting. 

The code: https://github.com/chrideki/MLS_2019

The Tableau dashboard: https://tabsoft.co/2UuOW0J


Monday, July 27, 2020

U.S. Unemployment Rate

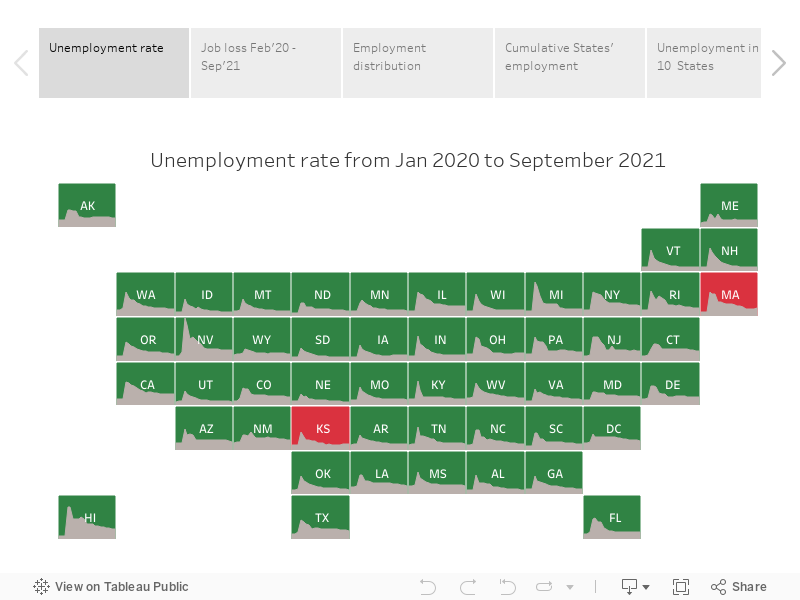
As known, unemployment is a big issue these days. I wanted to take a look at the data by State to see how things are doing across the country.
In this exercise, I made use of the API from the U.S. Bureau of Labor Statistics to get data about the unemployment rate in each State. The Python code I used to pull and manipulate data is available on github.
I'm so happy I learned how to create a tile grid map in Tableau, a very handful graph when it comes for example of political data. The Tableau file is available here.