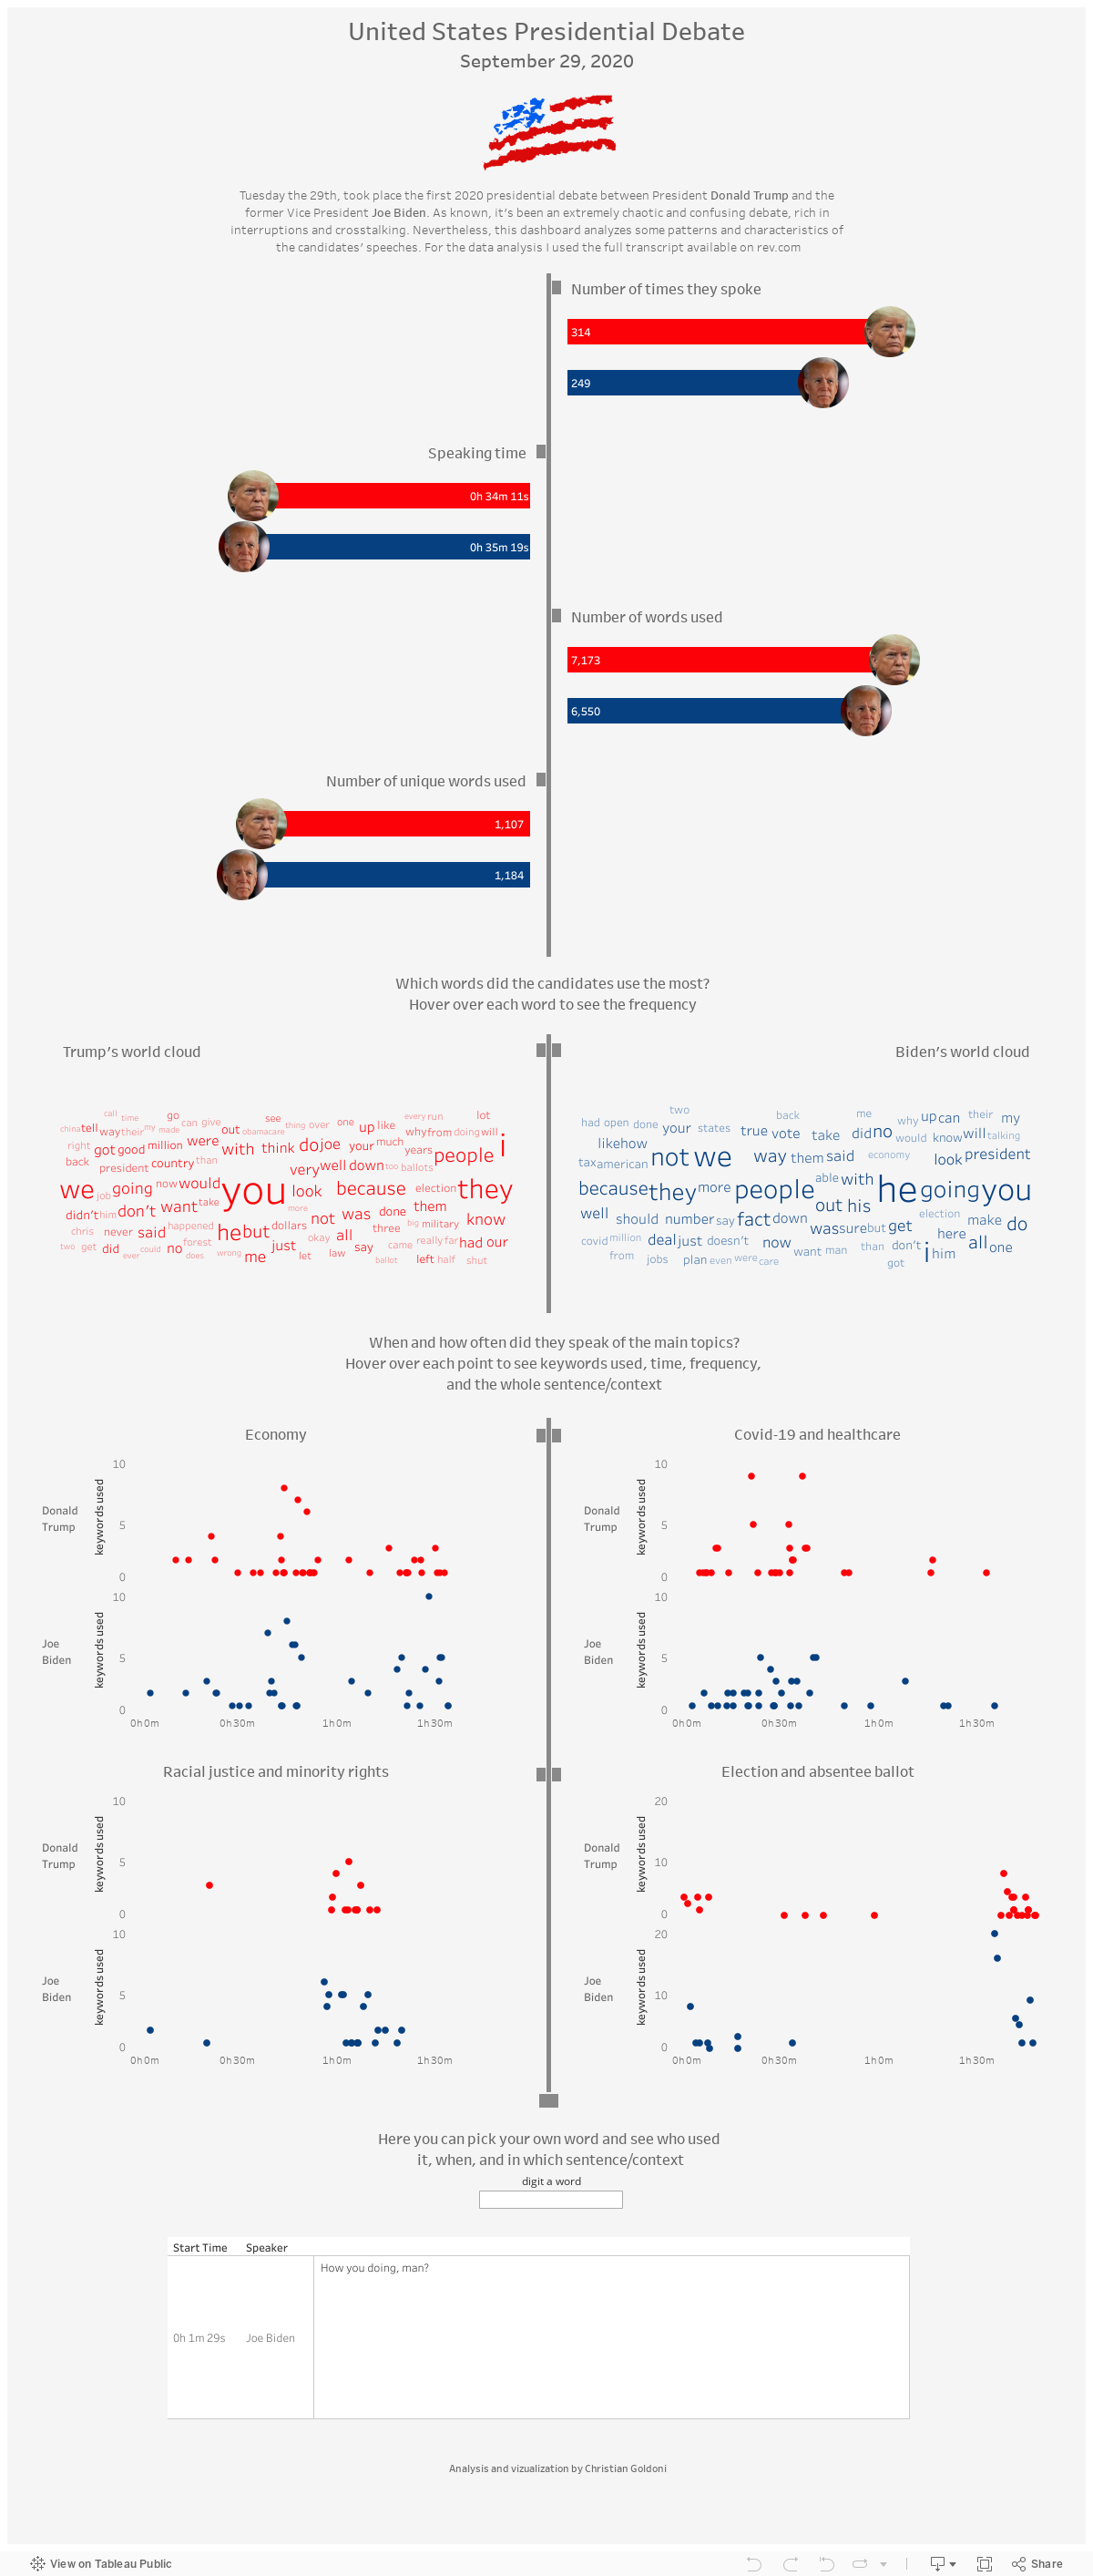
Tuesday the 29th, took place the first 2020 presidential debate between President Donald Trump and the former Vice President Joe Biden. As known, it's been an extremely chaotic and confusing debate, rich in interruptions and crosstalking. Nevertheless, this dashboard analyzes some patterns and characteristics of the candidates' speeches. For the data analysis I used the full transcript available on rev.com. Click here to see the dashboard and enjoy the Tableau interactions.
Showing posts with label US. Show all posts
Monday, October 19, 2020
Monday, July 27, 2020
U.S. Unemployment Rate
As known, unemployment is a big issue these days. I wanted to take a look at the data by State to see how things are doing across the country.
In this exercise, I made use of the API from the U.S. Bureau of Labor Statistics to get data about the unemployment rate in each State. The Python code I used to pull and manipulate data is available on github.
I'm so happy I learned how to create a tile grid map in Tableau, a very handful graph when it comes for example of political data. The Tableau file is available here.
Subscribe to:
Posts (Atom)